Data is essential for successful flower farming, and Heirloom’s Data Charts provide a powerful tool for tracking, analyzing, and customizing your flower-growing data to make informed decisions and optimize your yields.
Data Charts For Your Flower Farm
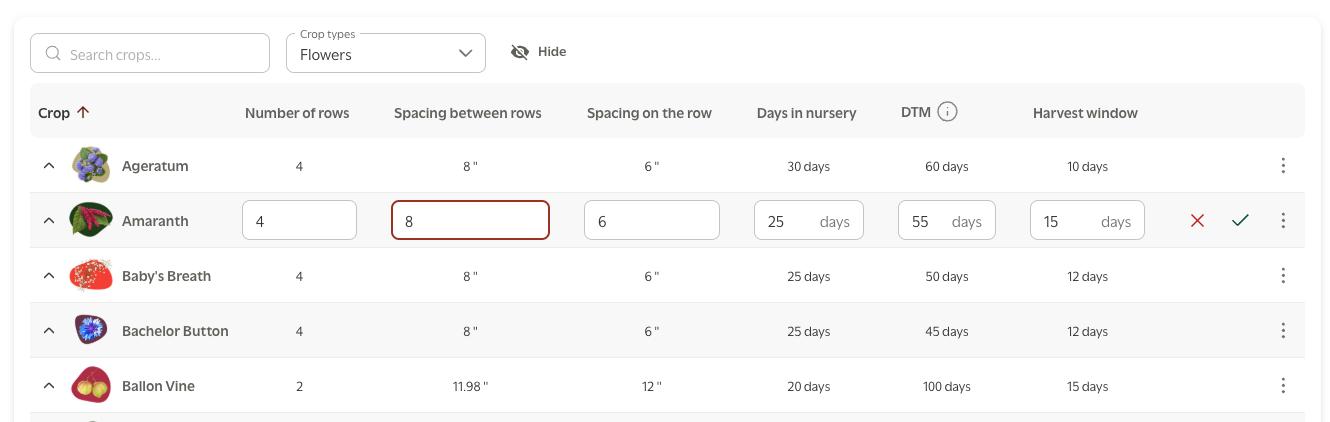
To get started with flower data in Heirloom, navigate to the Data Charts section. You can filter the charts to display only your flower crops by selecting “Flowers” in the Crop Type filter. Additionally, use the “Hide Unused Crops” filter to show only the flower crops you’ve selected for your current growing season.
You can adjust the agronomic values for each flower crop and cultivar directly within the Data Charts. While some data may be missing initially, you can easily input and customize values such as days to maturity, spacing, and expected yield. This detailed information is crucial for accurate planning and decision-making throughout Heirloom.
For example, the data you enter in the Data Charts informs the Game Plan, helping you determine optimal planting times and successions. It also influences the Crop Map, ensuring accurate spacing calculations and bed assignments. By mastering the Data Charts, you gain a deeper understanding of your flower crops and empower Heirloom to make smarter decisions on your behalf.
You can find more detailed tutorials on Data Charts here.
